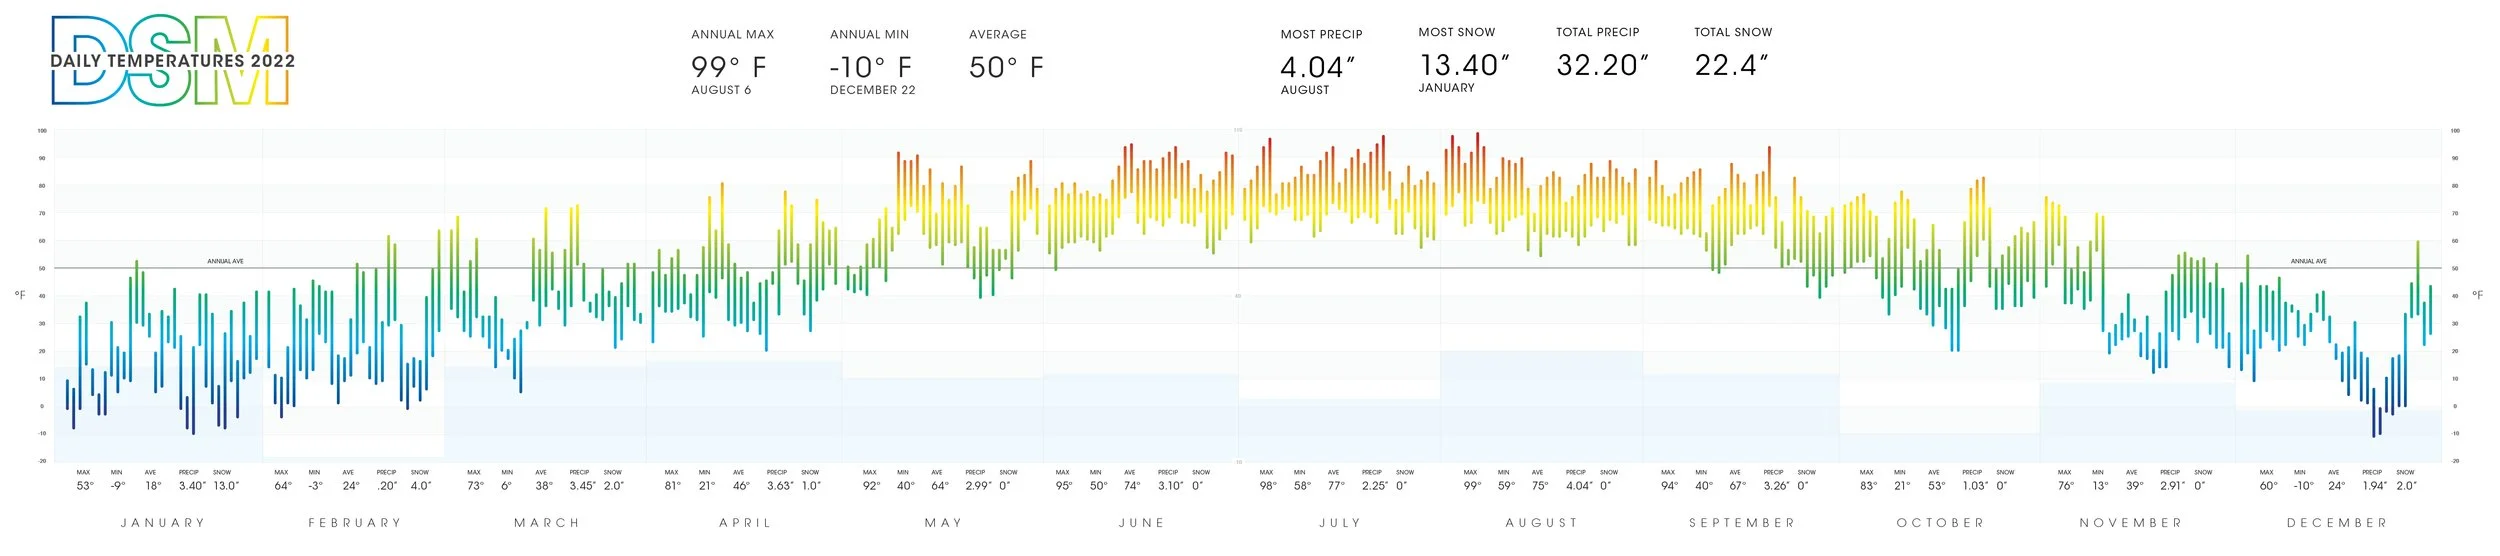
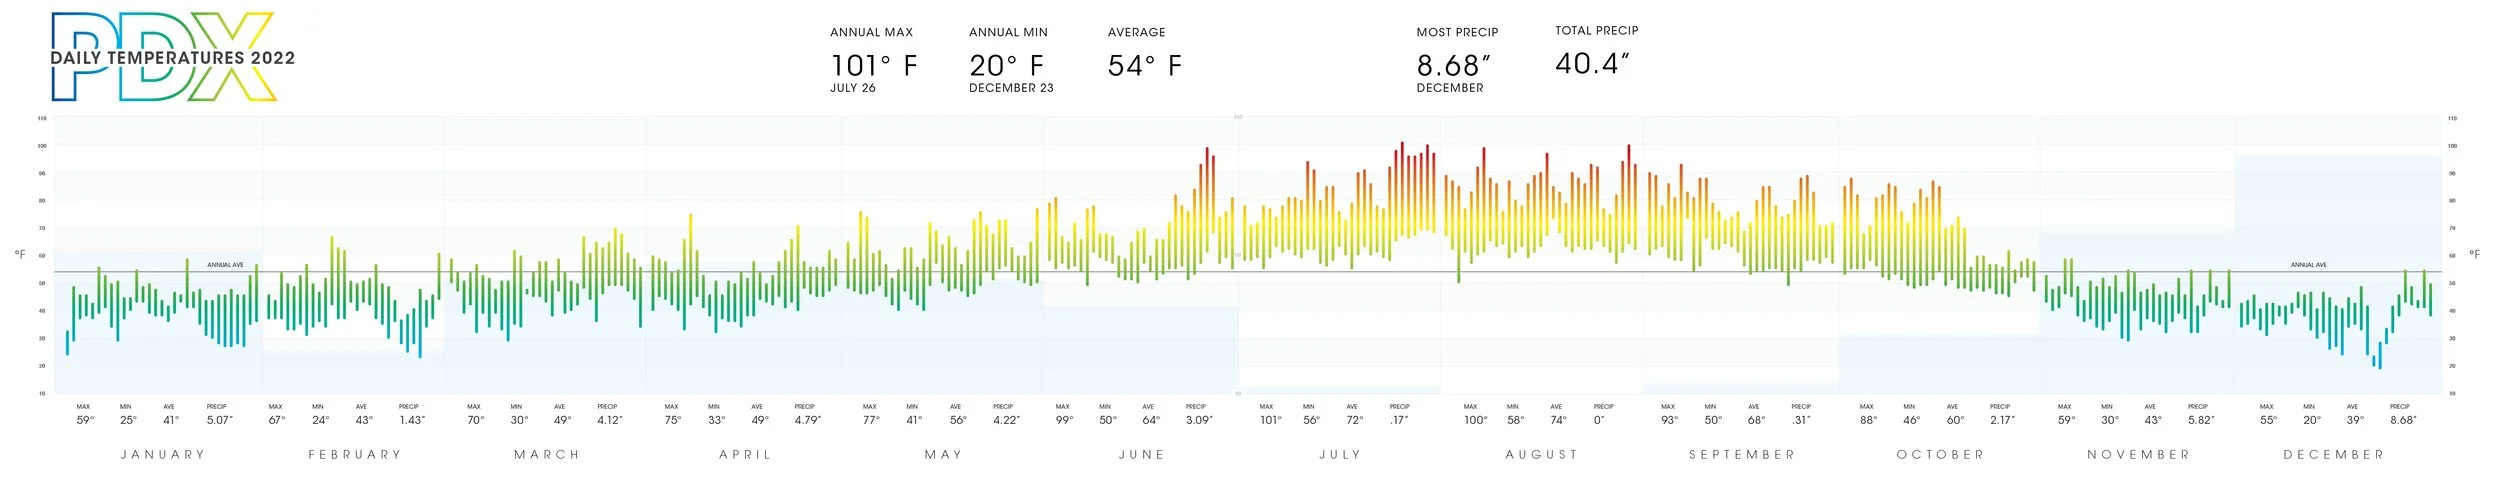
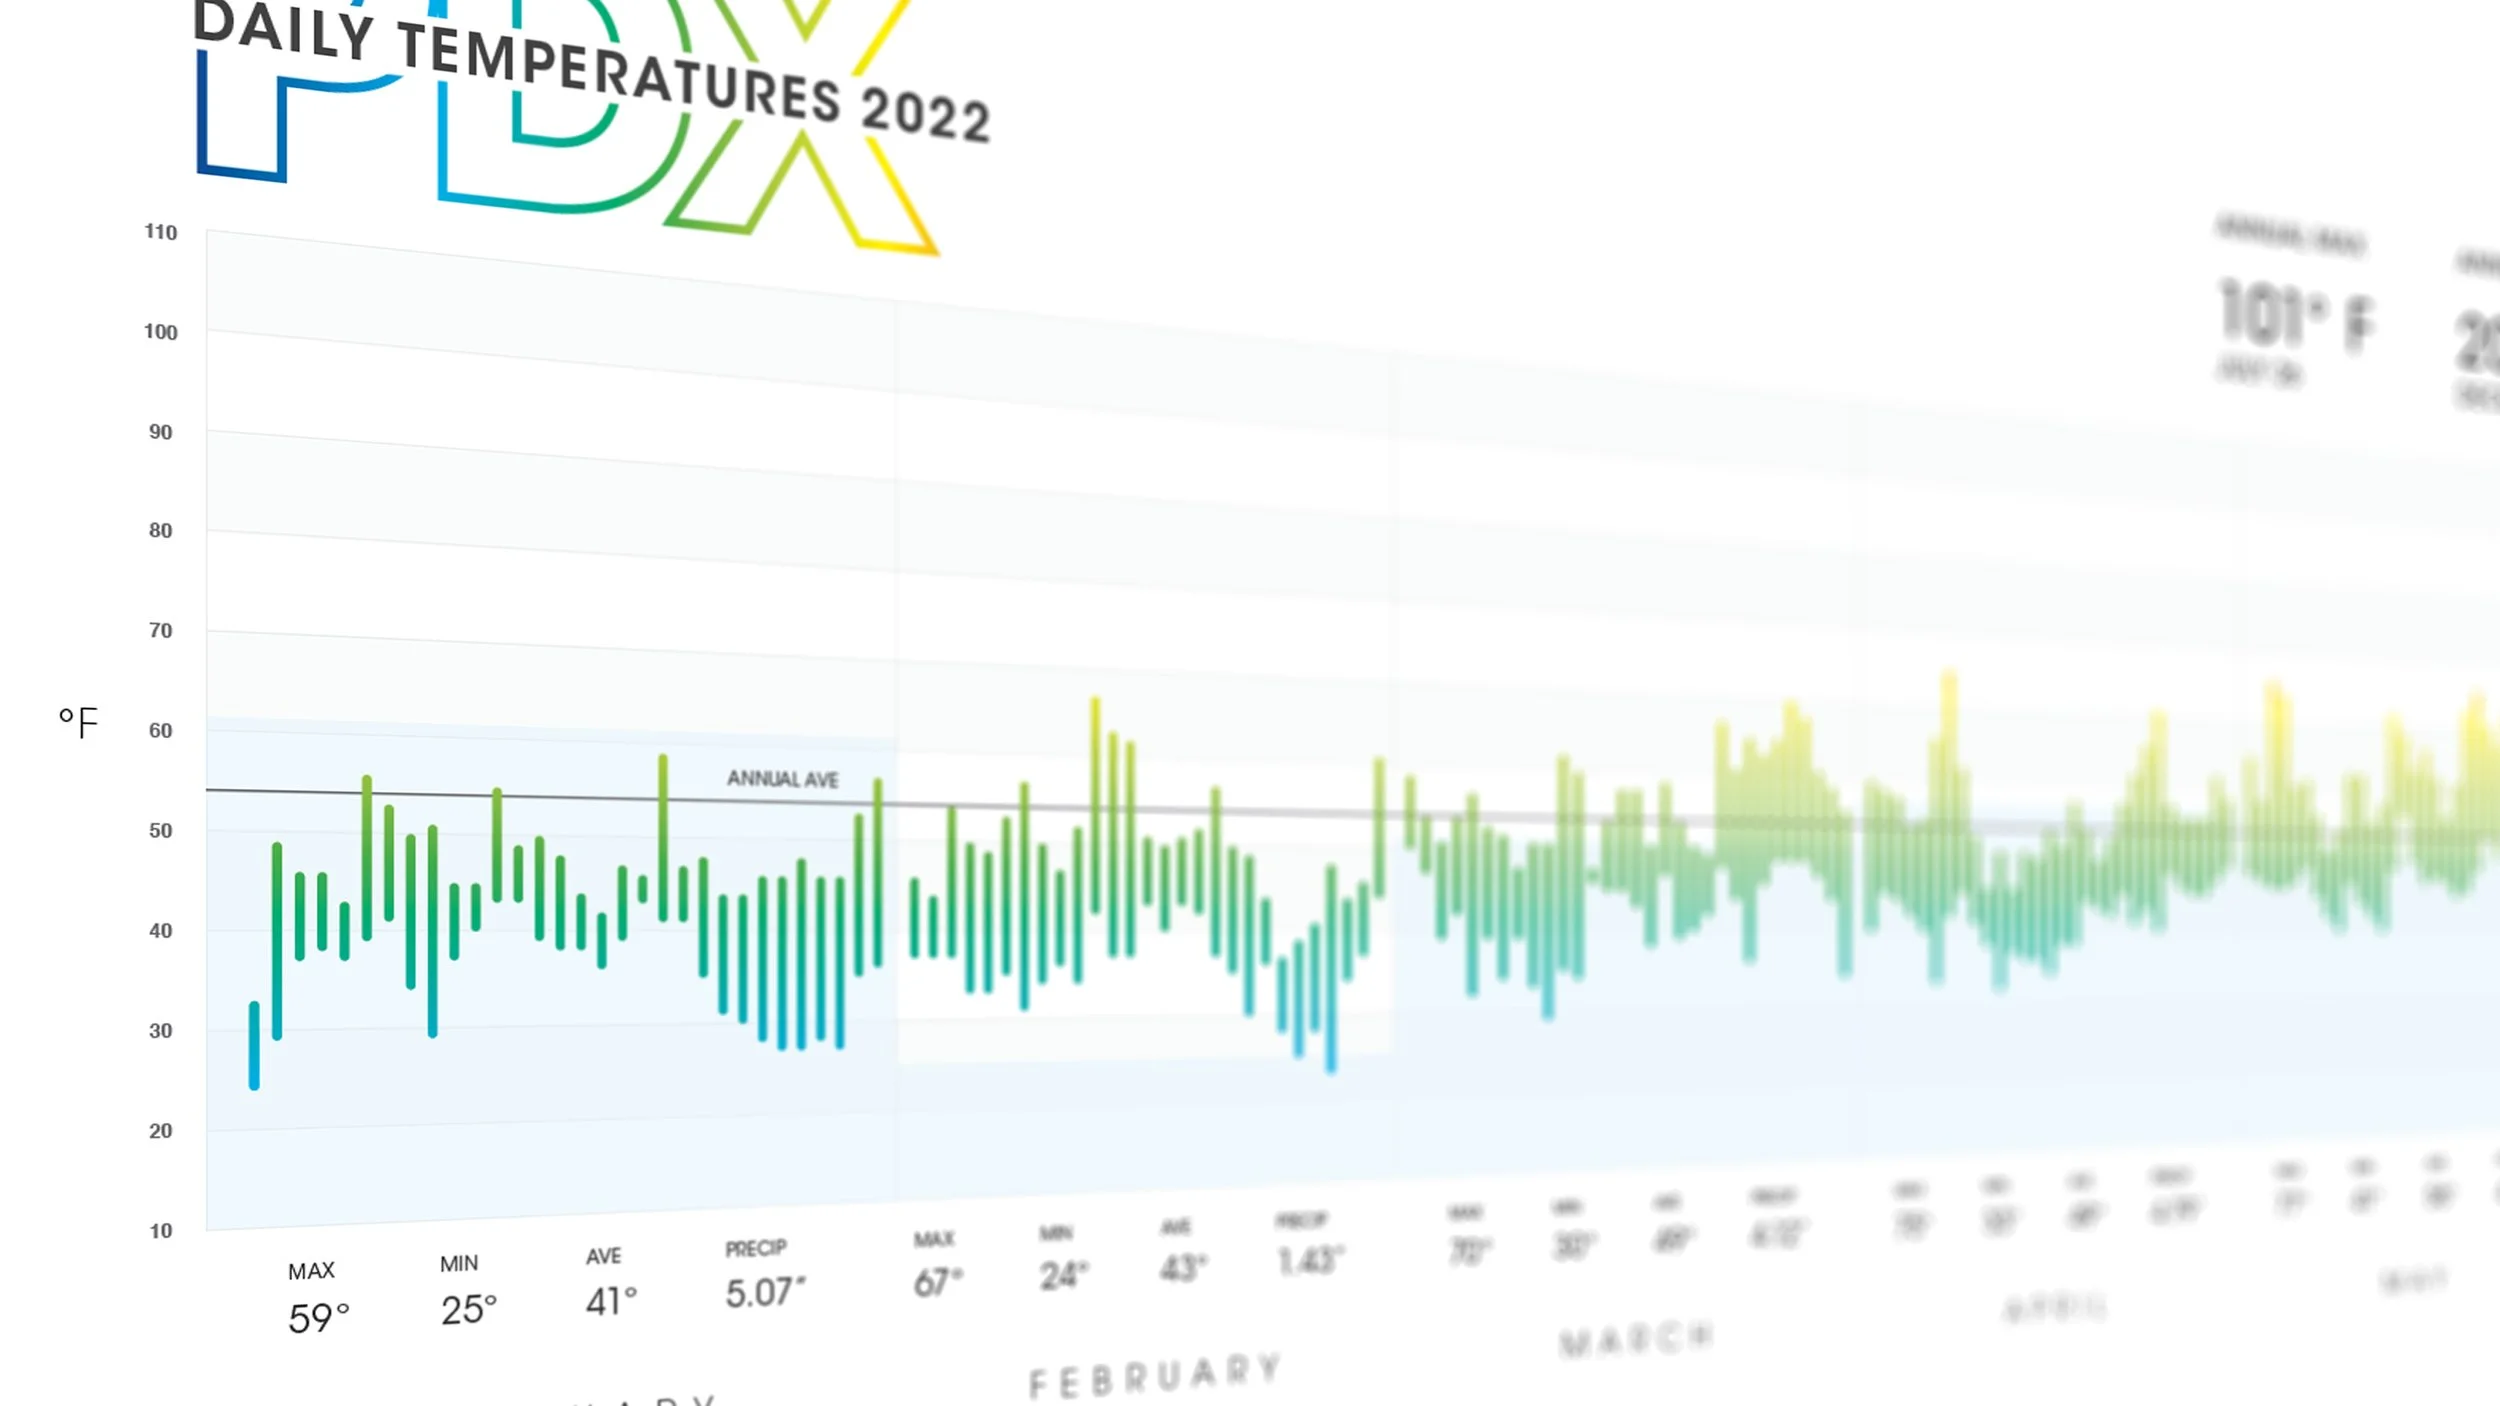
Des Moines vs Portland Weather Infographics
Growing up in the midwest involved tolerating very sporadic (and very cold!) weather. When I moved to Portland I noticed how remarkably consistent the weather seemed throughout the year. To see if I was perceiving it correctly, I charted a year’s worth of weather for each city, calling out highs, lows, precipitation and more.
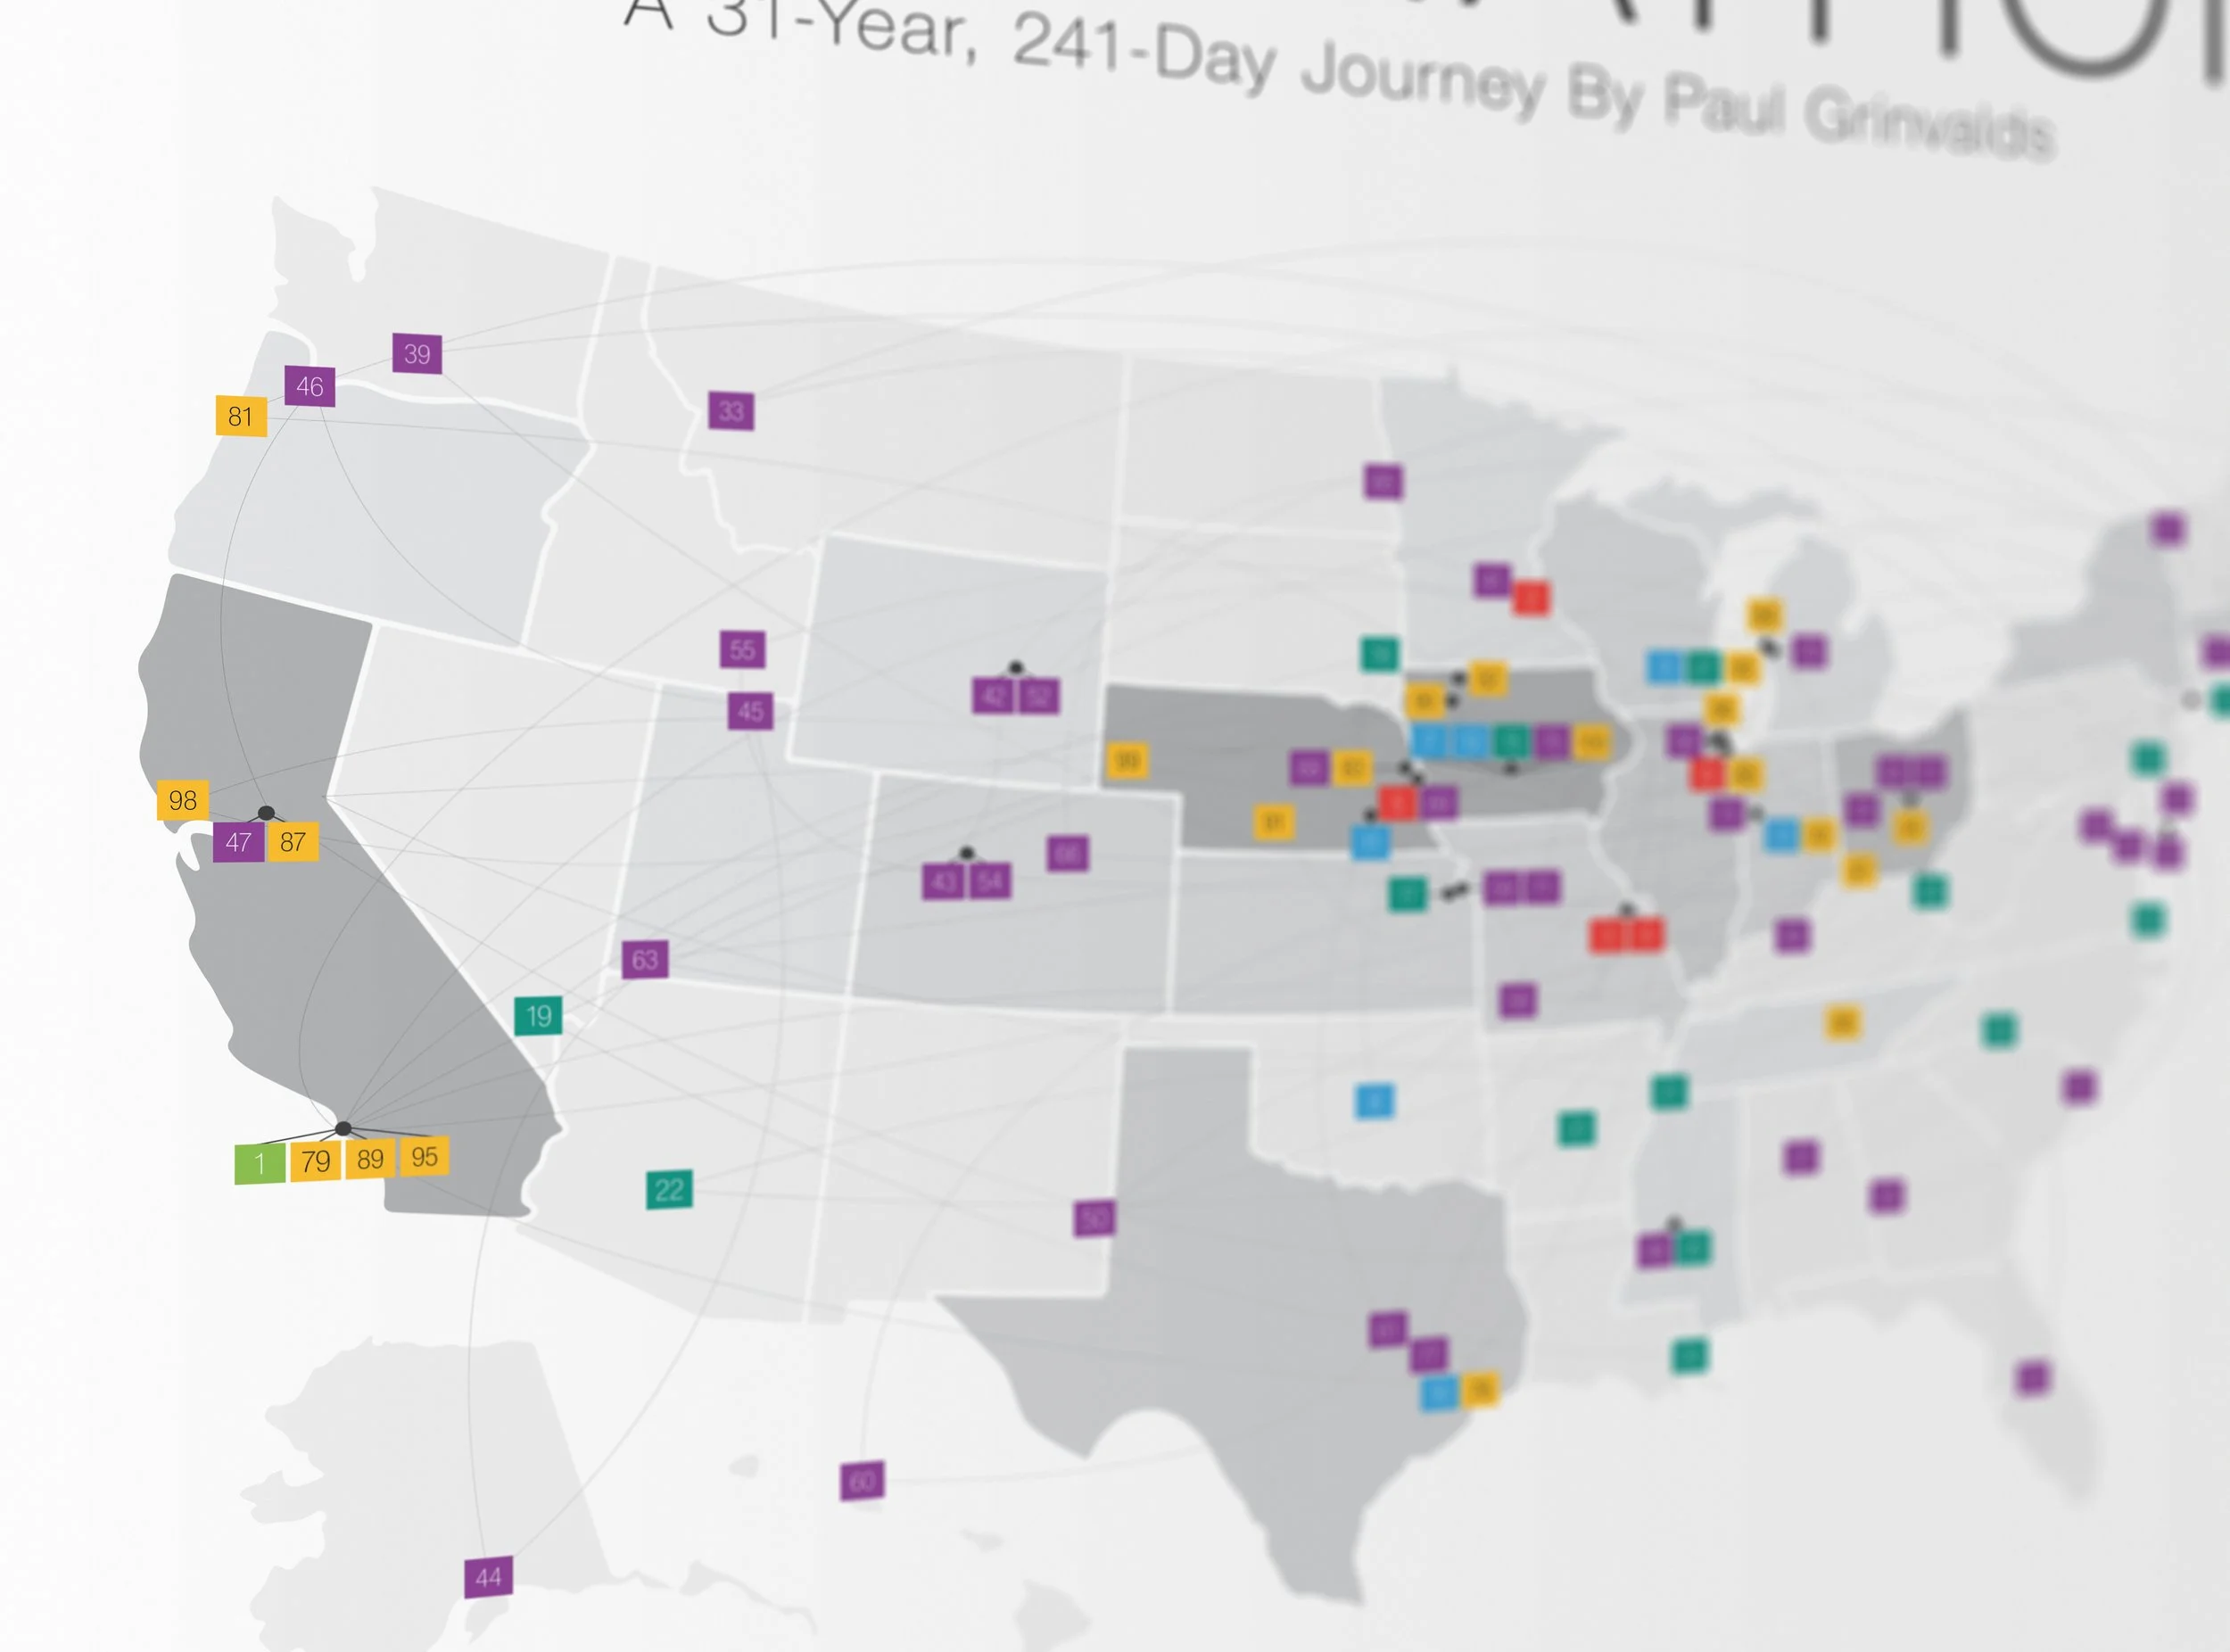
100 MARATHONS INFOGRAPHIC
My dad completed an insane accomplishment of running 100 marathons. He loves his data, so I thought it would be fun to commemorate the feat by compiling times, years, locations, and other bits of information from those races and turn them into a poster he could display.


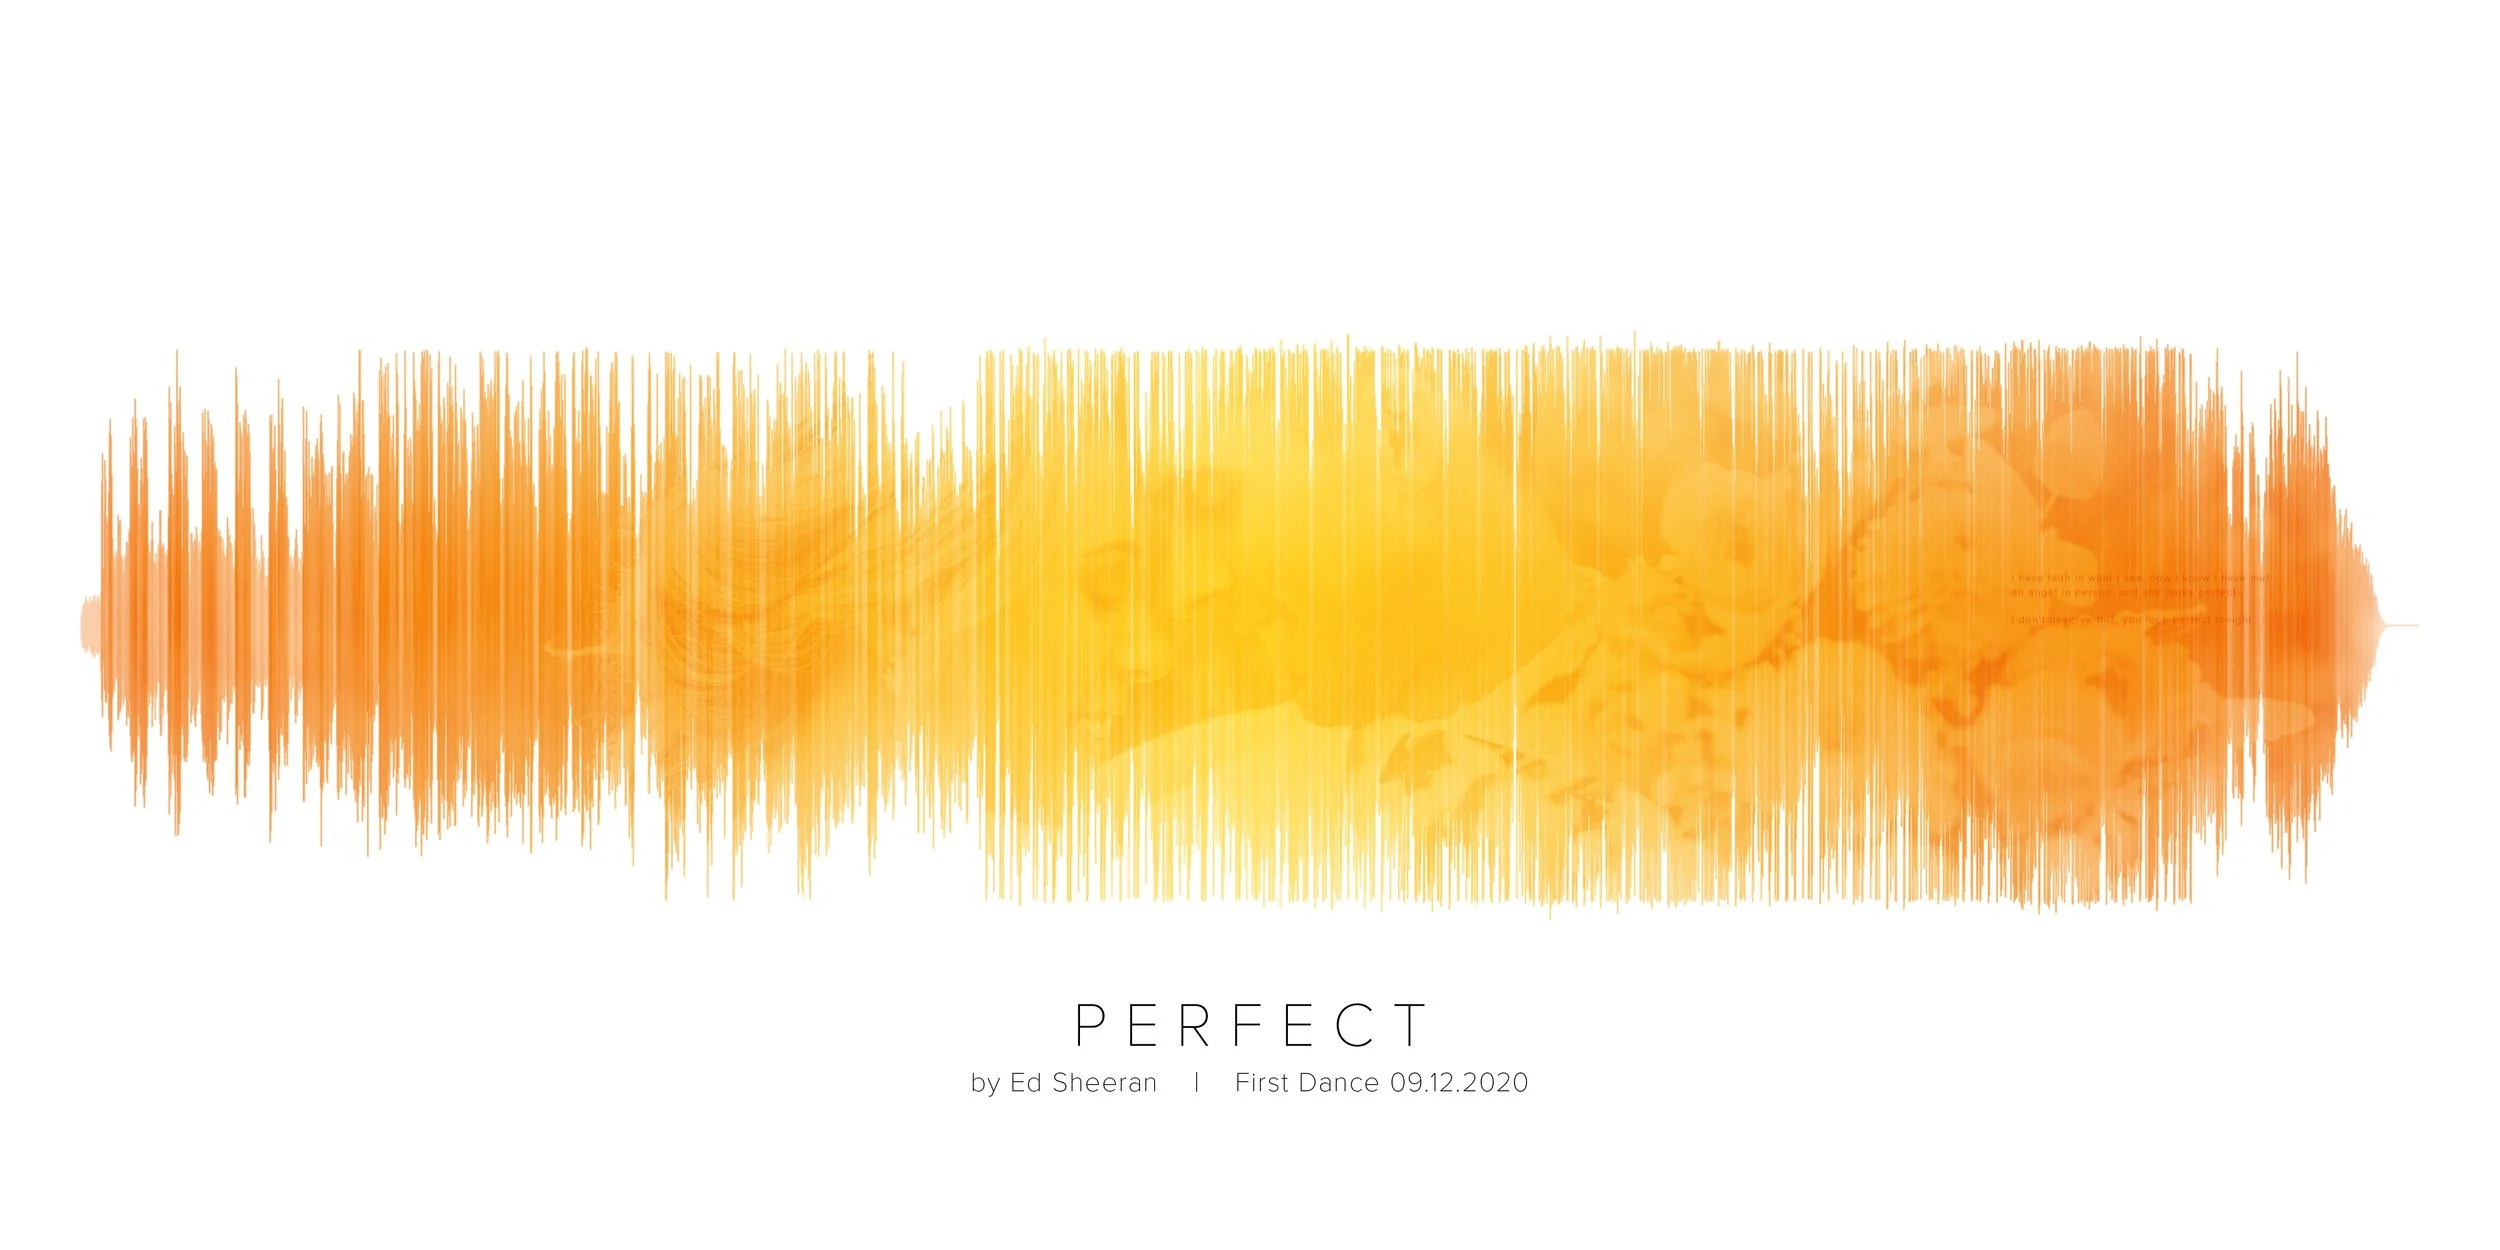
ANNIVERSARY FIRST DANCE WAVEFORMS
Like many couples who had their weddings planned for 2020, we had to reschedule due to Covid. We still opted to have a small outdoor ceremony on our original date in 2020 (in the midst of wildfires— don’t get me started), and moved the big party to the following year. As such, the first anniversary gift for my wife (“paper” themed) included two “first” dance songs from each ceremony that I had printed.
The orange waveform is from 2020, alluding to the color of the sky that day due to wildfires, and the blue one is from 2021, where it down poured at the reception. Very memorable days, I tell you! Each waveform included a photo from the day as well as a lyric from the song

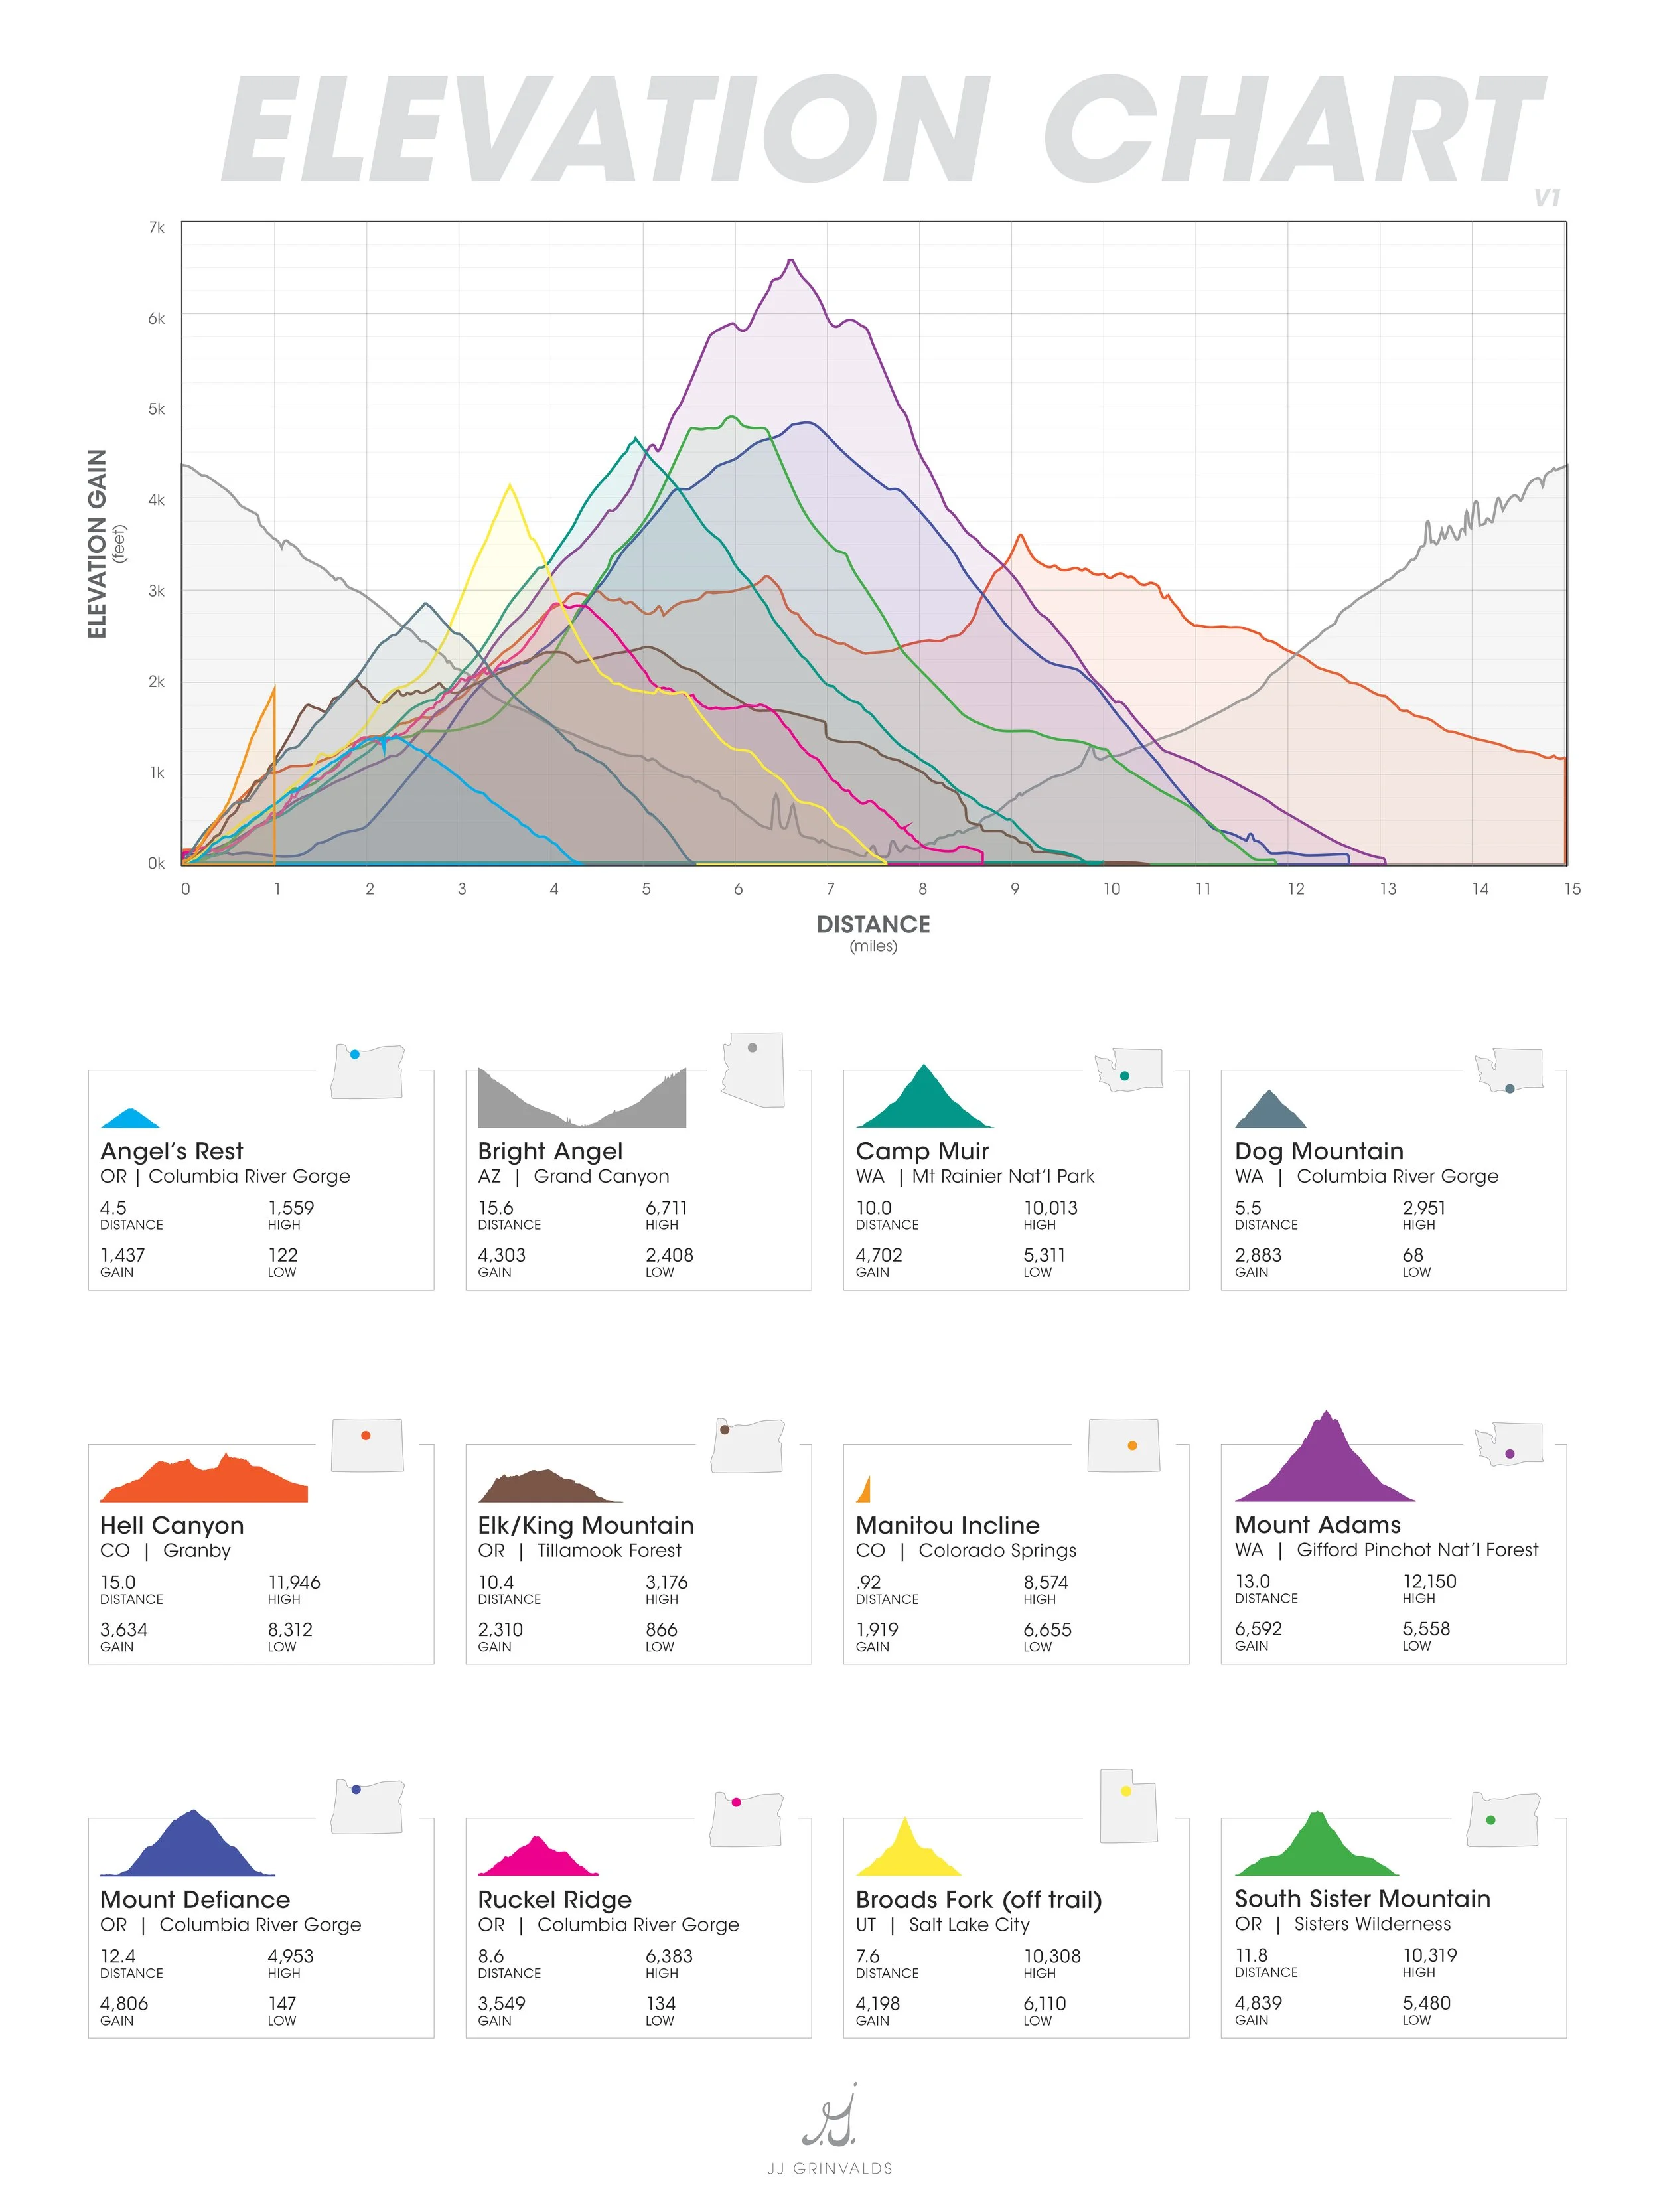
ELEVATION CHART INFOGRAPHIC
A to-scale representation of the elevation gain and loss on a number of hikes and climbs I have completed.
PHOTO A DAY TRILOGY
What began as a simple idea to watch my hair grow by taking a selfie each day after a particularly short haircut expanded into a trilogy of videos spanning over ten years and numerous big life events!